2020: Chaos is a Ladder
As 2020 comes to a close, I’ve started to see summaries of the year pop up, covering lessons learned from the year nobody saw coming… As years go, 2020 was full of those!
While I wish I could go back in time and tell myself to bet long on Zoom, toilet paper, and Bitcoin, I’m also itching to move forward to 2021. To take the lessons 2020 has made available to all of us to approach new challenges with better information, and more prepared than ever before.
Bugcrowd’s version of this year-in-review was the recent release of the Priority One Report – A New Decade in Crowdsourced Security. This report analyzed the growth in the crowdsourced security industry amidst the chaos of a pandemic and global reset of the nature of work itself. As we know in the security world, instability and chaos creates opportunity for bad actors, but the new and rapidly evolving digital landscape is leading to a business boom for locksmiths, not just burglars.
Bigger, Badder Bugs – And More of Them
Using data collected on the Bugcrowd platform, we analyzed submission and payment trends to better understand the state of crowdsourced security. In this blog, we provide a quick overview of some of these trends, including a bonus finding around payment trends by severity not included in the original report.
Bugcrowd received 50% more submissions in the last 12 months than the year prior. Throughout this period, there was a 65% increase in P1 submissions. P1 submissions are the most critical vulnerabilities. We didn’t just see an increase in quantity, we also saw an increase in quality and impact, which nets out to an increase in safety for users as these issues are resolved.. Overall submission quality improved slightly as the validity of vulnerabilities increased by 4% – Hackers are finding more bugs with greater impact, and communicating them to affected organizations with greater accuracy.
In the software sector, total vulnerability submissions in 2020’s first 10 months are up 24%, compared to all 12 months of 2019. During the same 10-month timeframe, P1 submissions in the software sector almost tripled compared to all of 2019.
Show Me the Money!
So vulnerability reports are on the rise, and the crowd is rising to the challenge of a changing Internet. What about payments?
Total payouts are growing steadily by about 15-20% per quarter. Buyers are seeing more bang for their buck as higher investment leads to more critical vulnerabilities being found.

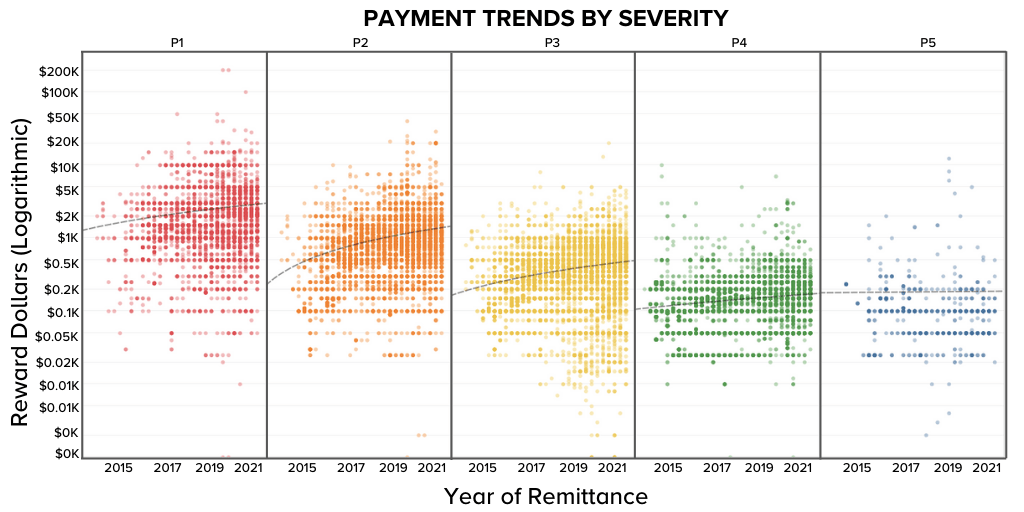
The above graph, a brand new insight not included in the original report, shows payment trends by severity according to Bugcrowd’s Vulnerability Rating Taxonomy since these records were available from the platform. From the graph, you can see:
- Bugcrowd’s highest paid bugs are at more than $200,000. Each different type of vulnerability (with P1 being the most severe and P5 being the least severe) shows a consistent trend upwards, with P2 vulnerabilities accelerating the steepest.
- P2 vulnerabilities balances a comparatively high impact and reward for the hackers finding them, and tends to be more common than P1s.
- The scatter plot shows some normalization across all severity bands, such as the concentration of payments filling within a standard deviation of the average. This indicates a maturation in that there are still a lot of exceptional vulnerabilities being found and getting paid above the average baseline.
To learn more about COVID-19’s impact on the security industry and industry trends, download the Priority One Report – A New Decade in Crowdsourced Security. It covers submission and payment data in more detail, how the hacker community evolved during the pandemic, information on how policy is impacting the security world and how you can make a difference, and how to get started with crowdsourced security.


